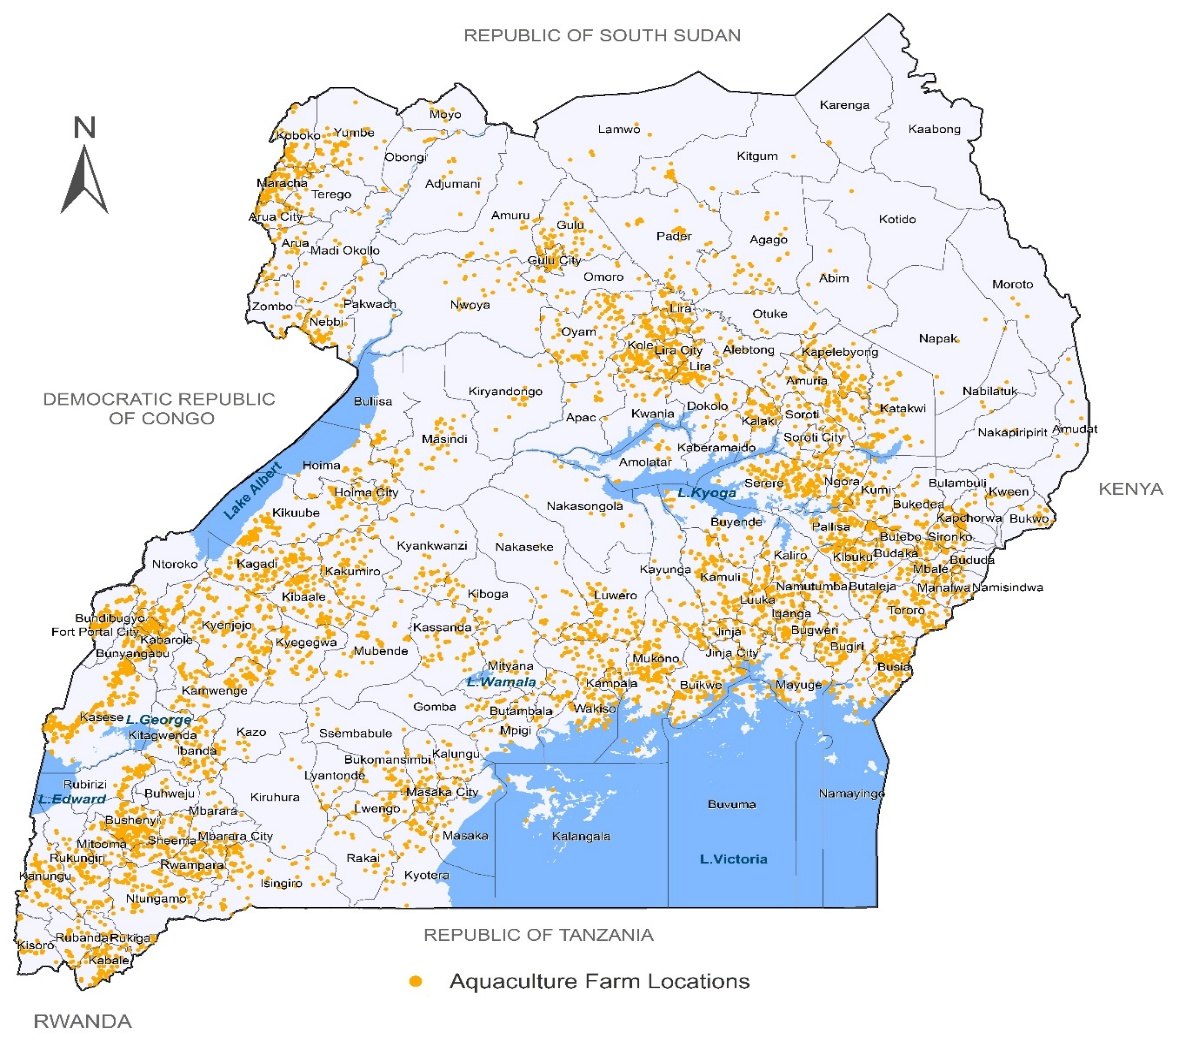
Total Aquaculture Farms
There were 9,463 aquaculture farms in the country. Of these, 6,408 (67.7%) farms were in rural areas, while 3,055 (32.3%) farms were in urban areas.
The first full count of the country's fish farms — where they are, what they raise, how much they harvest, and what they need to keep going.
Farming reaches almost every district, but production does not: Buikwe and Wakiso alone account for more than three-quarters of the national tonnage.
Three routes through the same figures — all traceable to the printed report.
Every chapter as charts, broken down by rural/urban, sub-region or ZARDI zone. Flip any chart to the table behind it.
Open dashboardFarms and production across all 146 districts, with a profile and rank for each one.
Open the mapAll 53 tables exactly as published, searchable, filterable and downloadable.
Browse tablesAll 26, exactly as the report's own chapter summaries put them.
There were 9,463 aquaculture farms in the country. Of these, 6,408 (67.7%) farms were in rural areas, while 3,055 (32.3%) farms were in urban areas.
97.1 percent of the aquaculture farms practiced only grow-out, 2.1 percent practiced both hatchery and grow-out while 0.8 percent practiced hatchery only.
36.8 percent of aquaculture farms had on-farm stores, 2.1 percent had fish processing units.
6,653 (70.9%) of the grow-out farms reported had no energy for use in aquaculture production activities. Solar system was the most common source used by 1,050 (11.2%) farms.
8,738 (93.1%) of the 9,390 grow-out aquaculture farms used ponds, 492 (4.6%) used cages, 198 (2.1%) used tanks and 243 (2.6%) used other production methods.
There were 24,348 ponds of which 70.3 percent were stocked. Cages were 3,135 and 58.3 percent were stocked. Tanks were 699 and 71.1 percent were stocked
7,240 (77.1%) of the grow-out farms practiced monoculture only. 1,501 (16.0%) practiced polyculture only while 649 (6.9%) practiced both monoculture and polyculture.
Eight (8) in every ten (7,555) grow-out farms cultured Tilapia, 48.7 percent (4,576) cultured catfish while 2.5 percent (234) cultured mirror carp.
About eight (8) in every ten (7,338) grow-out farms that cultured a species was mainly for sale purpose, while only 13.9 percent (1,309) cultured fish mainly for own consumption.
The total area under aquaculture was estimated at 5.48 million square metres with land-based production methods accounting for 98.4 percent of all the aquaculture surface area.
57.1 percent of ponds had a surface area of less than 200 sqm, while 37.3 percent measured between 200 and 800 sqm
A total of 1,693 stocked cages recorded nationally, 1,034 cages were rectangular or square. While 764 cages were circular.
Out of the 9,390 grow-out farms, 5,273 (56.2%) farms harvested fish in the reference period. Of those that harvested, 3,621 (68.7%) were in rural areas.
For the 12 months from July 2024 to June 2025, the estimated total aquaculture production was 65,444 Metric Tonnes (MT).
Of the total production, Tilapia contributed 82.4 percent (53,924.1MT), Catfish contributed 17.3 percent (11,347.4MT), Mirror Carp contributed 0.2 percent, and other species contributed 0.1 percent.
For all fish species cultured, more than 75 percent of the production was sold.
The results showed that 8,097 farms had at least used fish feed during the census reference period. About 59.3 percent of the grow-out farms used farm made feeds, 50.8 percent used commercial floating feeds, 43.1 percent used plant by- product and wastes.
From July 2024 to June 2025, 1.18 million Metric Tonnes of fish feed were used of which 99.8 percent was commercial floating feed.
The total quantity of fish seed used was about 93 million. Of this total, 75.1 percent of the seed was for Tilapia, 24.2 percent for Catfish and 0.4 percent for Mirror carp.
5,233 farms hired workers during the reference period.
53.3 percent of the aquaculture farms received extension services during the reference period.
A total of 273 hatcheries were recorded in the year 2024/2025. Of these, 90.5 percent bred tilapia, 43.6 percent bred catfish, 7.7 percent bred mirror carp and 4.8 percent bred other fish species.
The total installed seed production capacity was 200.1 million, while actual production was 149.9 million seed. Urban hatcheries contributed 73.3 percent of total seed production.
57.9 percent of hatcheries obtained broodstock from own farm.
54.6 percent of hatcheries obtained broodstock from own farm.
Of the 247 tilapia hatcheries, 21.9 percent practiced sex reversal, 51.8 percent did not practice, while 26.3 percent did not state.